|
CATH - Protein
Structure Classification
Introduction
The CATH database is
a hierarchical domain classification of protein structures in the Brookhaven
protein databank. All non-protein, model, and "C-alpha only" structures
are not classified in CATH. Only crystal structures solved to resolution
better than 3.0 angstroms are considered, together with NMR structures.
This filtering of the Brookhaven databank is performed using the program
SIFT (Michie et al, (1996)). There are four major levels in this hierarchy;
Class, Architecture, Topology (fold family) and Homologous superfamily.
Each level is described below, together with the methods used for assigning
structures to a specific family.
Domains
Multidomain proteins
are subdivided into their constituent domains using a consensus procedure
(Jones et al, submitted), based on three independent algorithms
for domain recognition (DETECTIVE (Swindells, 1995), PUU (Holm & Sander,
1994) and DOMAK (Siddiqui and Barton, 1995). This currently allows approximately
53% of the proteins (i.e. those for which these algorithms agree) to be
defined as single or multidomain proteins automatically. The remaining
structures are assigned domain definitions manually, by choosing what was
determined to be the best assignment made by one of the algorithms, a new
assignment, or an alternative assignment obtained from the literature.
The multidomain proteins are then split into their separate domains. All
the classification is performed on individual protein domains.
The CATH hierarchy
 Class, C-level
Class is determined
according to the secondary structure composition and packing within the
structure. It can be assigned automatically for over 90% of the known structures
using the method of Michie et al. (1996). For the remainder, manual inspection
is used and where necessary information from the literature taken into
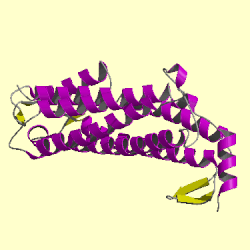
account. Three major classes are recognised; mainly-alpha, mainly-beta
and alpha-beta. This last class (alpha-beta) includes both alternating
alpha/beta structures and alpha+beta structures, as originally defined
by Levitt and Chothia (1976). A fourth class is also identified which contains
protein domains which have low secondary structure content.
 Architecture, A-level
This describes the
overall shape of the domain structure as determined by the orientations
of the secondary structures but ignores the connectivity between the secondary
structures. It is currently assigned manually using a simple description
of the secondary structure arrangement e.g. barrel or 3-layer sandwich.
Reference is made to the literature for well-known architectures (e.g the
beta-propellor or alpha four helix bundle). Procedures are being developed
for automating this step.
 Topology (Fold family), T-level
Structures are grouped
into fold families at this level depending on both the overall shape and
connectivity of the secondary structures. This is done using the structure
comparison algorithm SSAP (Taylor & Orengo (1989)). Parameters for
clustering domains into the same fold family have been determined by empirical
trials throughout the databank (Orengo et al. (1992), Orengo et al. (1993)).
Structures which have a SSAP score of 70 and where at least 60% of the
larger protein matches the smaller protein are assigned to the same T level
or fold family.
Some fold families are very
highly populated (Orengo et al. (1994)) particularly within the mainly-beta
2-layer sandwich architectures and the alpha-beta 3-layer sandwich architectures.
In order to appreciate the structural relationships within these families
more easily, they are currently subdivided using a higher cutoff on the
SSAP score (75 for some mainly-beta and alpha-beta families, 80 for some
mainly-alpha families, together with a higher overlap requirement (70%)).
 Homologous Superfamily, H-level
This level groups
together protein domains which are thought to share a common ancestor and
can therefore be described as homologous. Similarities are identified first
by sequence comparisons and subsequently by structure comparison using
SSAP. Structures are clustered into the same homologous superfamily if
they satisfy one of the following criteria:
-
Sequence identity >= 35%, 60%
of larger structure equivalent to smaller
-
SSAP score >= 80.0 and sequence
identity >= 20%
60% of larger structure
equivalent to smaller
-
SSAP score >= 80.0, 60% of larger
structure equivalent to smaller, and
domains which have related
functions
 Sequence families, S-level
Structures within
each H-level are further clustered on sequence identity. Domains clustered
in the same sequence families have sequence identities >35% (with at least
60% of the larger domain equivalent to the smaller), indicating highly
similar structures and functions.
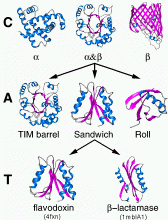
DIAGRAM
DEPICTING THE HIERARCHICAL NATURE OF CATH
> Back
to Index page |
|

|