Please note that you are looking at an abridged version of the output (all checks that gave normal results have been removed from this report). You can have a look at the Full report instead.
  12 ARG  (  18 ) T
  70 ARG  (  76 ) T
  84 ARG  (  90 ) T
  91 ARG  (  97 ) T
  98 ARG  ( 104 ) T
 130 ARG  ( 136 ) T
 137 ARG  ( 143 ) T
 200 ARG  ( 206 ) T
 252 ARG  ( 258 ) T
 273 ARG  ( 279 ) T
 345 ARG  ( 357 ) T
  13 TYR  (  19 ) T
 227 TYR  ( 233 ) T
 349 TYR  ( 361 ) T
   3 PHE  (   9 ) T
  50 PHE  (  56 ) T
  73 PHE  (  79 ) T
  82 PHE  (  88 ) T
 167 PHE  ( 173 ) T
 170 PHE  ( 176 ) T
 340 PHE  ( 352 ) T
 369 PHE  ( 381 ) T
 373 PHE  ( 385 ) T
   8 ASP  (  14 ) T
  46 ASP  (  52 ) T
  92 ASP  (  98 ) T
 134 ASP  ( 140 ) T
 135 ASP  ( 141 ) T
 144 ASP  ( 150 ) T
 244 ASP  ( 250 ) T
 276 ASP  ( 282 ) T
 366 ASP  ( 378 ) T
  41 GLU  (  47 ) T
  43 GLU  (  49 ) T
  63 GLU  (  69 ) T
  83 GLU  (  89 ) T
  85 GLU  (  91 ) T
 107 GLU  ( 113 ) T
 118 GLU  ( 124 ) T
 136 GLU  ( 142 ) T
 153 GLU  ( 159 ) T
 197 GLU  ( 203 ) T
 269 GLU  ( 275 ) T
 298 GLU  ( 304 ) T
 311 GLU  ( 317 ) T
 362 GLU  ( 374 ) T
Improper dihedrals are a measure of the chirality/planarity of the structure at a specific atom. Values around -35 or +35 are expected for chiral atoms, and values around 0 for planar atoms. Planar side chains are left out of the calculations, these are better handled by the planarity checks.
Three numbers are given for each atom in the table. The first is the Z-score for the improper dihedral. The second number is the measured improper dihedral. The third number is the expected value for this atom type. A final column contains an extra warning if the chirality for an atom is opposite to the expected value.
23 ASP ( 29 ) T C 4.5 8.1 0.0
314 ILE ( 320 ) T C
Atom names starting with "-" belong to the previous residue in the chain. If the second atom name is "--SS", the disulphide bridge has a deviating length.
21 LYS ( 27 ) T N -C 0.934 -19.8
RMS Z-score for bond lengths: 0.454
RMS-deviation in bond distances: 0.010
  21 LYS  (  27 ) T     -O   -C    N    84.818 -23.9
  21 LYS  (  27 ) T     -CA  -C    N   155.082  18.4
  21 LYS  (  27 ) T     -C    N    CA  149.081  15.2
RMS Z-score for bond angles: 0.554
RMS-deviation in bond angles: 1.255
25 GLU ( 31 ) T 5.313
These scores give an impression of how ``normal'' the torsion angles in protein residues are. All torsion angles except omega are used for calculating a `normality' score. Average values and standard deviations were obtained from the residues in the WHAT IF database. These are used to calculate Z-scores. A residue with a Z-score of below -2.0 is poor, and a score of less than -3.0 is worrying. For such residues more than one torsion angle is in a highly unlikely position.
 283 THR  ( 289 ) T -2.8297
 317 PRO  ( 329 ) T -2.6521
 245 THR  ( 251 ) T -2.2146
 202 VAL  ( 208 ) T -2.1027
 316 ILE  ( 328 ) T -2.0942
 142 PRO  ( 148 ) T -2.0563
 201 GLY  ( 207 ) T -2.0238
Residues with ``forbidden'' phi-psi combinations are listed, as well as residues with unusual omega angles (deviating by more than 3 sigma from the normal value). Please note that it is normal if about 5 percent of the residues is listed here as having unusual phi-psi combinations.
  20 GLY  (  26 ) T omega poor
  21 LYS  (  27 ) T Poor phi/psi
  23 ASP  (  29 ) T Poor phi/psi
  66 GLN  (  72 ) T Poor phi/psi
 123 PRO  ( 129 ) T Poor PRO-phi
 136 GLU  ( 142 ) T Poor phi/psi
 142 PRO  ( 148 ) T Poor PRO-phi
 144 ASP  ( 150 ) T Poor phi/psi
 176 LYS  ( 182 ) T Poor phi/psi
 219 ASN  ( 225 ) T Poor phi/psi
 226 SER  ( 232 ) T Poor phi/psi
 229 PRO  ( 235 ) T Poor phi/psi
 316 ILE  ( 328 ) T Poor phi/psi
 317 PRO  ( 329 ) T Poor PRO-phi
 331 ARG  ( 343 ) T Poor phi/psi
 359 ASN  ( 371 ) T Poor phi/psi
Standard deviation of omega values : 1.919
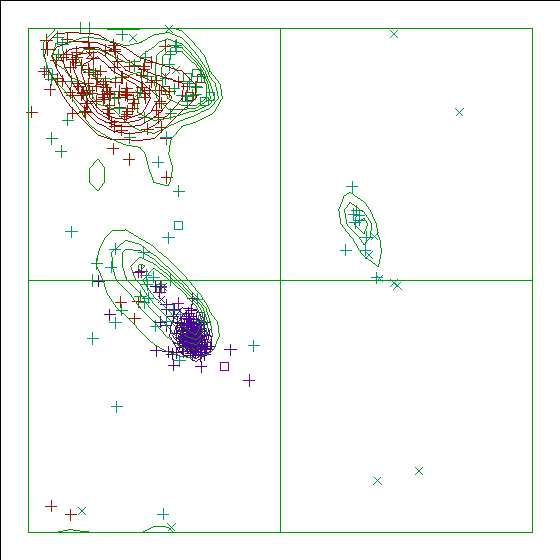
In a colour picture, the residues that are part of a helix are shown in blue, strand residues in red. "Allowed" regions for helical residues are drawn in blue, for strand residues in red, and for all other residues in green.
The contact distances of all atom pairs have been checked. Two atoms are said to `bump' if they are closer than the sum of their Van der Waals radii minus 0.40 Angstrom. For hydrogen bonded pairs a tolerance of 0.55 Angstrom is used. The first number in the table tells you how much shorter that specific contact is than the acceptable limit. The second distance is the distance between the centers of the two atoms.
The last text-item on each line represents the status of the atom pair. The text `INTRA' means that the bump is between atoms that are explicitly listed in the PDB file. `INTER' means it is an inter-symmetry bump. If the final column contains the text 'HB', the bump criterium was relaxed because there could be a hydrogen bond. Similarly relaxed criteria are used for 1--3 and 1--4 interactions (listed as 'B2' and 'B3', respectively). If the last column is 'BF', the sum of the B-factors of the atoms is higher than 80, which makes the appearance of the bump somewhat less severe because the atoms probably aren't there anyway.
Bumps between atoms for which the sum of their occupancies is lower than one are not reported. In any case, each bump is listed in only one direction.
  70 ARG  (  76 ) T    NH1  --  297 ARG  ( 303 ) T    NE     0.458   2.542 INTER BF
  22 ARG  (  28 ) T    O    --   24 GLN  (  30 ) T    N      0.440   2.260 INTRA BF
  22 ARG  (  28 ) T    O    --   23 ASP  (  29 ) T    C      0.429   2.371 INTRA BF
  43 GLU  (  49 ) T    CD   --  385 HOH  (HOH  ) A     21    0.414   2.786 INTRA BF
  22 ARG  (  28 ) T    N    --   25 GLU  (  31 ) T    O      0.329   2.221 INTRA BF
  20 GLY  (  26 ) T    O    --   21 LYS  (  27 ) T    N      0.324   1.476 INTRA B2
 378 ALA  ( 390 ) T    CB   --  380 HOH  (HOH  ) A     62    0.294   2.906 INTRA
 182 LYS  ( 188 ) T    NZ   --  378 ALA  ( 390 ) T    CB     0.293   2.807 INTRA
 293 HIS  ( 299 ) T    CE1  --  383 HOH  (HOH  ) A    110    0.282   2.918 INTRA
 125 HIS  ( 131 ) T    CE1  --  183 SER  ( 189 ) T    N      0.262   2.838 INTRA
 316 ILE  ( 328 ) T    CG1  --  317 PRO  ( 329 ) T    N      0.258   2.842 INTRA
 382 HOH  (HOH  ) A    115  --  383 HOH  (HOH  ) A    103    0.244   2.806 INTER HB
  21 LYS  (  27 ) T    CA   --   25 GLU  (  31 ) T    O      0.244   2.556 INTRA BF
 231 GLY  ( 237 ) T    N    --  234 HIS  ( 240 ) T    CD2    0.240   2.860 INTRA
 325 GLY  ( 337 ) T    N    --  383 HOH  (HOH  ) A    116    0.231   2.719 INTRA HB
 380 HOH  (HOH  ) A    129  --  380 HOH  (HOH  ) A    130    0.230   2.820 INTRA HB
  42 GLY  (  48 ) T    N    --  381 HOH  (HOH  ) A     19    0.229   2.721 INTRA HB
 331 ARG  ( 343 ) T    N    --  382 HOH  (HOH  ) A    120    0.226   2.724 INTRA HB
  70 ARG  (  76 ) T    NH1  --  297 ARG  ( 303 ) T    CD     0.226   2.874 INTER BF
  37 ARG  (  43 ) T    NH2  --   52 GLU  (  58 ) T    CB     0.221   2.879 INTRA BF
 371 ALA  ( 383 ) T    N    --  380 HOH  (HOH  ) A    138    0.217   2.733 INTRA HB
  21 LYS  (  27 ) T    CG   --   26 TRP  (  32 ) T    CE2    0.212   2.988 INTRA BF
 338 GLU  ( 350 ) T    CD   --  383 HOH  (HOH  ) A    110    0.208   2.992 INTRA
 207 LEU  ( 213 ) T    CA   --  383 HOH  (HOH  ) A     70    0.206   2.994 INTRA
 200 ARG  ( 206 ) T    NH2  --  383 HOH  (HOH  ) A     81    0.202   2.748 INTER HB
And so on for a total of 139 lines
The packing environment of the residues is compared with the average packing environment for all residues of the same type in good PDB files. A low packing score can indicate one of several things: Poor packing, misthreading of the sequence through the density, crystal contacts, contacts with a co-factor, or the residue is part of the active site. It is not uncommon to see a few of these, but in any case this requires further inspection of the residue.
 140 PHE  ( 146 ) T  -6.18
 257 HIS  ( 263 ) T  -5.67
 200 ARG  ( 206 ) T  -5.59
 317 PRO  ( 329 ) T  -5.58
 275 LEU  ( 281 ) T  -5.54
 176 LYS  ( 182 ) T  -5.40
 341 LYS  ( 353 ) T  -5.32
 351 ASN  ( 363 ) T  -5.24
358 ILE ( 370 ) T -2.72
It is not necessarily an error if a few residues have rotamer values below 0.3, but careful inspection of all residues with these low values could be worth it.
  33 SER  (  39 ) T   0.35
 259 ASN  ( 265 ) T   0.36
 202 VAL  ( 208 ) T   0.37
 128 SER  ( 134 ) T   0.39
For this check, backbone conformations are compared with database structures using C-alpha superpositions with some restraints on the backbone oxygen positions.
A residue mentioned in the table can be part of a strange loop, or there might be something wrong with it or its directly surrounding residues. There are a few of these in every protein, but in any case it is worth looking at!
  23 ASP  (  29 ) T  0
  24 GLN  (  30 ) T  0
 135 ASP  ( 141 ) T  0
 136 GLU  ( 142 ) T  0
 348 CYS  ( 360 ) T  0
  22 ARG  (  28 ) T  1
  93 PHE  (  99 ) T  1
  95 GLU  ( 101 ) T  1
 140 PHE  ( 146 ) T  2
 176 LYS  ( 182 ) T  2
 380 HOH  (HOH  ) A    141
 383 HOH  (HOH  ) A     87
 384 HOH  (HOH  ) A     50
  24 GLN  (  30 ) T
  64 GLN  (  70 ) T
  66 GLN  (  72 ) T
 125 HIS  ( 131 ) T
 219 ASN  ( 225 ) T
 234 HIS  ( 240 ) T
 259 ASN  ( 265 ) T
 293 HIS  ( 299 ) T
 333 ASN  ( 345 ) T
 365 ASN  ( 377 ) T
Hydrogen bond donors that are buried inside the protein normally use all of their hydrogens to form hydrogen bonds within the protein. If there are any non hydrogen bonded buried hydrogen bond donors in the structure they will be listed here. In very good structures the number of listed atoms will tend to zero.
   5 THR  (  11 ) T    OG1
  11 SER  (  17 ) T    OG
  37 ARG  (  43 ) T    NE
  44 ILE  (  50 ) T    N
  64 GLN  (  70 ) T    NE2
  79 SER  (  85 ) T    N
  82 PHE  (  88 ) T    N
 103 ASP  ( 109 ) T    N
 130 ARG  ( 136 ) T    NH1
 137 ARG  ( 143 ) T    NE
 154 TYR  ( 160 ) T    OH
 156 SER  ( 162 ) T    OG
 183 SER  ( 189 ) T    OG
 210 ASN  ( 216 ) T    ND2
 211 PHE  ( 217 ) T    N
 268 GLU  ( 274 ) T    N
 276 ASP  ( 282 ) T    N
 286 LYS  ( 292 ) T    N
 305 LYS  ( 311 ) T    N
 308 ARG  ( 314 ) T    NE
 315 GLY  ( 327 ) T    N
 316 ILE  ( 328 ) T    N
 333 ASN  ( 345 ) T    ND2
 354 ARG  ( 366 ) T    NH2
 360 ALA  ( 372 ) T    N
 368 SER  ( 380 ) T    OG
 378 ALA  ( 390 ) T    N
Side-chain hydrogen bond acceptors that are buried inside the protein normally form hydrogen bonds within the protein. If there are any not hydrogen bonded in the optimized hydrogen bond network they will be listed here.
25 GLU ( 31 ) T OE2
The second part of the table mostly gives an impression of how well
the model conforms to common refinement constraint values. The first part
of the table shows a number of constraint-independent quality indicators.
Structure Z-scores, positive is better than average:
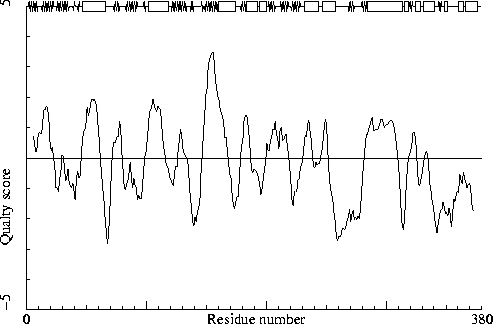
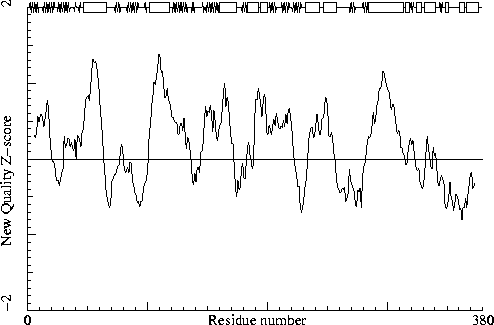
  1st generation packing quality :   0.749
  2nd generation packing quality :   1.161
  Ramachandran plot appearance   :  -0.117
  chi-1/chi-2 rotamer normality  :   1.288
  Backbone conformation          :  -0.155
RMS Z-scores, should be close to 1.0:
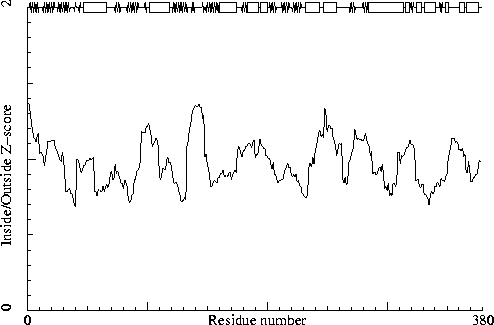
  Bond lengths                   :   0.454 (tight)
  Bond angles                    :   0.554 (tight)
  Omega angle restraints         :   0.349 (tight)
  Side chain planarity           :   0.634 (tight)
  Improper dihedral distribution :   0.466
  B-factor distribution          :   0.558
  Inside/Outside distribution    :   0.985
The second part of the table mostly gives an impression of how well the model conforms to common refinement constraint values. The first part of the table shows a number of constraint-independent quality indicators, which have been calibrated against structures of similar resolution.
Resolution found in PDB file : 1.90
Structure Z-scores, positive is better than average:
  1st generation packing quality :   1.3
  2nd generation packing quality :   0.4
  Ramachandran plot appearance   :   0.3
  chi-1/chi-2 rotamer normality  :   1.7
  Backbone conformation          :  -0.5
RMS Z-scores, should be close to 1.0:
  Bond lengths                   :   0.454 (tight)
  Bond angles                    :   0.554 (tight)
  Omega angle restraints         :   0.349 (tight)
  Side chain planarity           :   0.634 (tight)
  Improper dihedral distribution :   0.466
  B-factor distribution          :   0.558
  Inside/Outside distribution    :   0.985