|
PHYSICAL CHEMISTRYI | |
|
PHYSICAL CHEMISTRYI | |
| THEORY AND COMPUTATIONALCHEMISTRY |

|
DARMSTADT UNIVERSITY OF TECHNOLOGY DEPARTMENT OF CHEMISTRY Prof. Dr. J. Brickmann Group. (http://www.pc.chemie.tu-darmstadt.de/) |
|
|
 |
Molecular Docking
This sequenze was broadcast by the german television (ZDF) in Abenteuer Forschung. |
|
Molecular Dynamics Movies
This movie exhibits a flight through a membrane model. The model is a snap shot taken from a molecular dynamics simulation. The system was built by assembling the simulation cell in a 3x3 array. As a result, the model consists of 123,903 atoms, 864 DLPE molecules and 14,365 water molecules. The movie starts above the membrane surface and the observer flights through the water phase into the middle of the bilayer. After a 90 degree rotation the observer leaves the bilayer backwards and a cross-section can be seen. This movie was broadcast by the german television (HR3) as part
of a report about the SFB 199 (Ecophysiology of Plants).
The animation shows the dynamics of the DLPE bilayer. The sequenze depicts
the motion of the atoms during a period of 120 picoseconds.
In this movie a cross section of the bilayer can be seen (red-white:
water layers, grey-white: hydrocarbon chains, yellow: headgroups). This
time the motion of the atoms during the simulation is visualized.
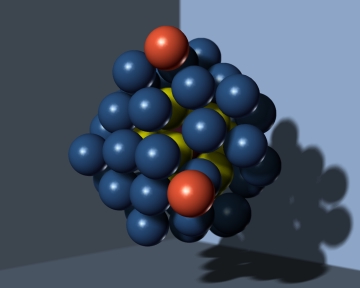
Visualization of a molecular-dynamics run of an argon cluster with 55
atoms. The argon atoms are color coded according to their position in the
cluster (pink=center, yellow=1. shell, blue=2. layer, red=floater).
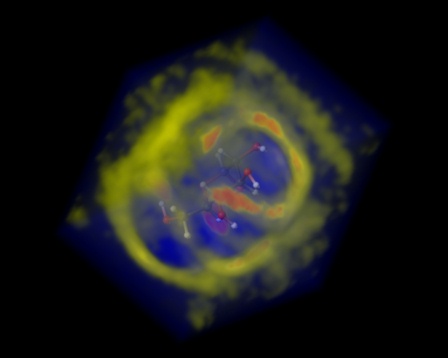
Visualization of a 3D data field using 3D texture mapping. The water
density around a glucose molecule is calculated from a MD simulation and
stored on a 3D data field. The information on this grid is transformed
directly on a stack of planes aligned parallel to the screen using 3D texture
mapping. The density of the clouds in space depends on the water density.
Additionally, the different regions are color coded (red = highest density,
yellow = medium density, blue = normal water density). The contents of
this movie can be rendered interactively with more then 20 frames per second
on a Silicon Graphics Onyx
Reality
Engine 2.
|