function check_flags() { if (!document.array.flags.checked) { document.array.flagged.checked = false; } return false; } function check_flagged() { if (document.array.flagged.checked && !document.array.flags.checked) { document.array.flagged.checked = false; alert("This option is only available if the 'Use flags' option is selected"); } return false; } function open_image(file, file1) { win3 = window.open("http://dnmad.bioinfo.cnio.es/?run=winimage&image="+file,file1,"width=470,height=510,resizable=0,directories=0,location=0,status=0,scrollbars=0,toolbar=0,menubar=0"); win3.focus(); return false; } function close_win(image) { window.close(image); return false; } function help_win(anchor) { win_help = window.open("http://dnmad.bioinfo.cnio.es/help/dnmad-help.html"+anchor,"DNMAD_HELP","resizable=1,directories=1,location=1,status=1,scrollbars=1,toolbar=1,menubar=1"); win_help.focus(); return false; } function open_win(res, times, what, pid, file) { if (res == "box") { if (what == "individual") { win1 = window.open("http://dnmad.bioinfo.cnio.es//?run=images"+times+"&res=box&pid="+pid+"&array="+file,"Box_Images","resizable=1, directories=1,location=1,status=1,scrollbars=1,toolbar=1,menubar=1"); win1.focus(); } else if (what == "selection") { var files = ""; for (var i=0; i
DNMAD Bioinformatics Unit   -   CNIO

 DNMAD


WARNING: in print-tip loess normalization, only 89 samples in array 1 grid row 5 grid column 3
WARNING: in print-tip loess normalization, only 92 samples in array 2 grid row 5 grid column 3
WARNING: in print-tip loess normalization, only 89 samples in array 3 grid row 5 grid column 3

Results


Summary:
    Normalization method:Print-tip loess
    Options selected:Use flags
Return flagged points as NA
Use background subtraction

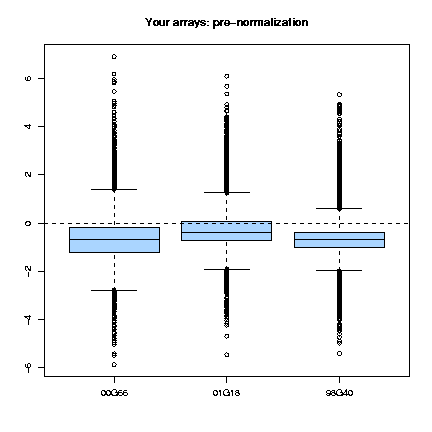
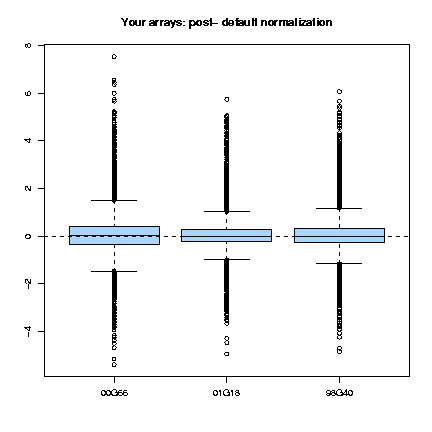
Boxplots of the pre- and post-normalization intensity log-ratios M for all your arrays   


Boxplots by print-tip of the pre- and post- default normalization intensity log-ratios M for each array (download all)  Pre- and post- default normalization MA-plot for each array, with the lowess fits for individual print-tips groups (download all)  Diagnostic plots for each array (download all)  

      Boxplot for 00G66.txt
      Boxplot for 01G18.txt
      Boxplot for 98G40.txt


      MA-plot for 00G66.txt
      MA-plot for 01G18.txt
      MA-plot for 98G40.txt


      Diag. plots for 00G66.txt
      Diag. plots for 01G18.txt
      Diag. plots for 98G40.txt


Default
normalization
Next
step of
normalization

Send to
Preprocessor
                              
Click here for
slide scale
normalization


Download
normalized
M values
                              

Download
normalized
A values